Exploring Beyond Graphene: Nanocarbon and 2D Materials e-book
As we continue to venture into our Year of Graphene, it’s time to explore some other forms of carbon and 2D materials. Dive into our ebook to discover how Edinburgh Instruments supports cutting-edge research in this dynamic field.
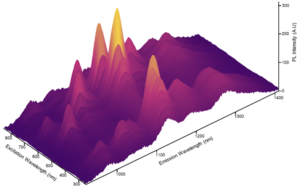
Discover how excitation emission matrix spectroscopy can be used to analyse Single Wall Carbon Nanotubes (SWNT). SWCNTs are interesting because their electronic properties heavily depend on the chiral index of the tube structure. This is a tuneable property meaning SWCNTs can be tailored to specific applications. Many SWCNT synthesis methods result in a mixture of chiral structures and identifying the chiral structures present in a synthesised sample is therefore vital. Uncover the power of photoluminescence spectroscopy in accurately identifying SWCNTs’ chiral structures.

Figure 1: Excitation Emission Matrix of the SWCNT sample.
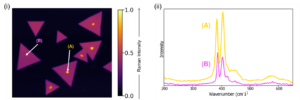
Graphene, the pioneering ultra-thin 2D material, opened the door to a realm of possibilities. Since its discovery researchers have pushed the field further, discovering more 2D materials which can, in some cases, offer even better optoelectronic properties. 2D transition metal dichalcogenides (TMDs) represent one type exciting material, poised to rival graphene’s dominance. Learn how correlative Raman and photoluminescence imaging techniques provide detailed insights into factors such as layer number, strain, doping, and defects, crucial for the growth and development of 2D TMDs like MoS2.

Figure 2: (i) Raman intensity imaging of MoS2 crystals using the E2g and A1g bands. (ii) Raman spectra from areas of low and high Raman signal.
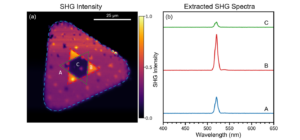
While Raman and photoluminescence imaging offer substantial information on 2D TMDs, our RMS1000 platform can integrate an additional technique: Second Harmonic Generation (SHG) imaging. This non-linear optical process enables the interrogation of layer stacking orientation. Using a mode-locked femtosecond pulsed laser, areas identified as multilayer WSe2 can be studied to determine layer orientation in bilayer and trilayer WSe2. Unlock the full potential of nanocarbon and 2D materials with Edinburgh Instruments’ advanced analytical tools.

Figure 3: Second Harmonic Generation imaging of WSe2. (a) Intensity of the SHG peak at 520 nm. (b) extracted SHG response from areas A, B, and C.
Find out more about these cutting edge materials by downloading our eBook: Nanocarbon and 2D Materials


