Photoluminescence in Raman Spectra – Friend or Foe?
In Raman spectroscopy, photoluminescence (PL), also referred to as fluorescence, is often considered an undesired effect. Strong PL backgrounds can mask Raman peaks making some samples extremely difficult to analyse. Whilst there are numerous ways to help reduce the effect of PL on Raman spectra, in some applications PL can be extremely useful. As a technique, PL spectroscopy can provide electronic information about a sample, which in some cases is not achievable in Raman and is complimentary to the vibrational information from Raman.
This blog highlights when PL and Raman spectroscopy can be used in combination for full sample characterisation. From foe to friend thanks to the wealth of information the two techniques can provide.
Key Points
- Raman and photoluminescence can use the same hardware – meaning your Raman microscope becomes two instruments in one
- Both methods benefit from being non-contact and non-destructive
- Rapid characterisation of the vibrational and electronic properties of a sample
- Confocal microscope offers Raman and PL imaging with sub-micron spatial resolution
2D Materials
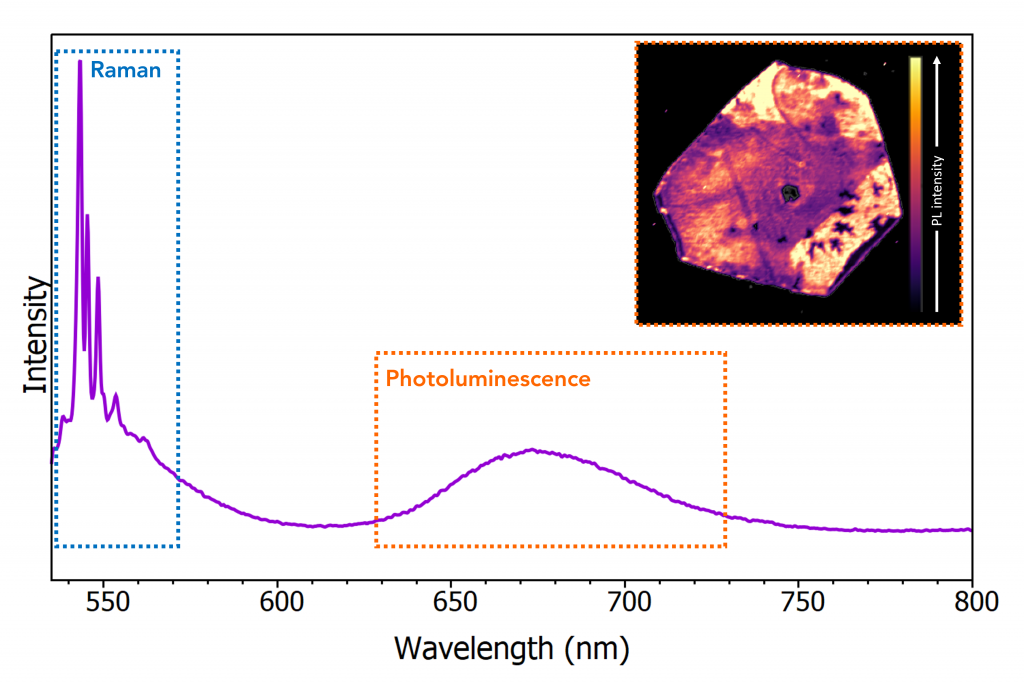
2D transition metal dichalcogenides, such as tungsten disulfide (WS2), are a class of emerging materials with unique optical and electronic properties. Correlative Raman and PL imaging can be used to provide highly detailed information without any sample preparation. In the case of 2D materials, both the Raman and PL information can be captured in one spectrum using the same laser. The Raman peaks occur at the beginning of the spectrum, with the PL occurring enough of a distance away from the Raman so there is no overlap, Figure 1.

Figure 1: Raman and PL spectrum obtained simultaneously on a WS2 crystal. Inset shows the false colour PL intensity image of the crystal
The Raman bands can be used for layer number determination and strain evaluation. PL imaging adds further supporting data on layer number plus information on strain, doping, and defects.
Learn more about how the RM5 Raman Microscope can provide high resolution imaging of 2D materials: High-Resolution Raman & PL Imaging of MoS2.
Forensics
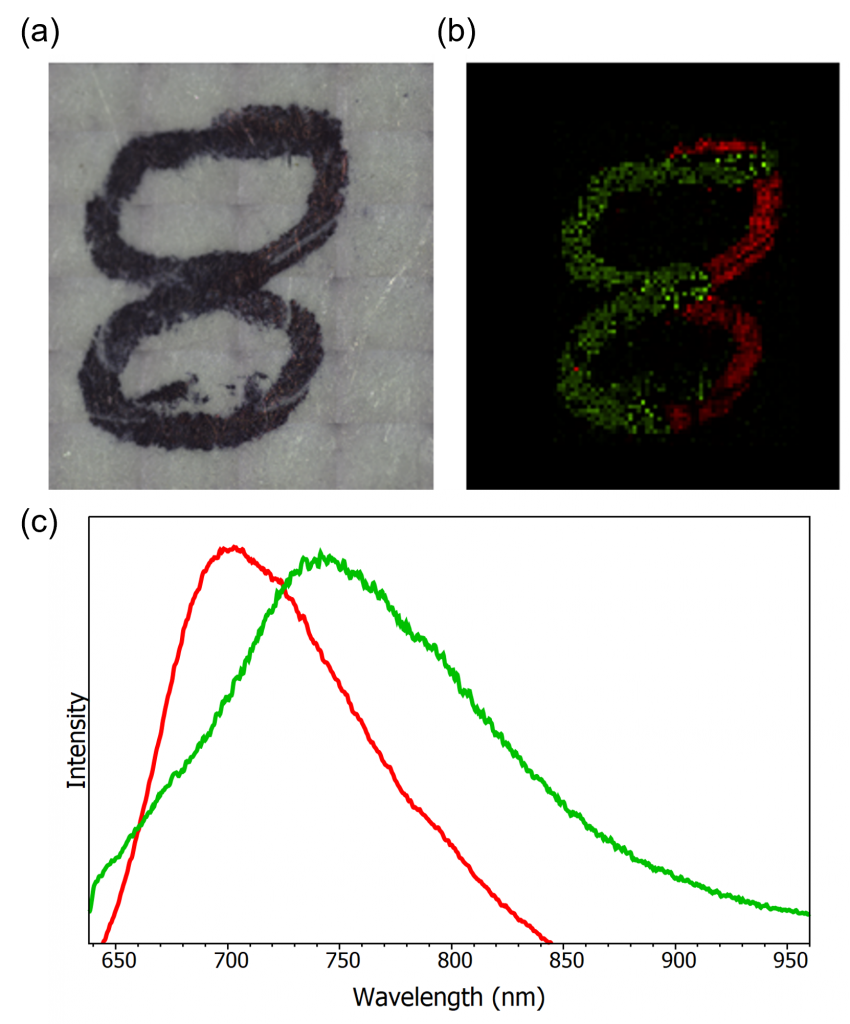
In a forensics laboratory, a wide range of samples need to be investigated, but in some instances, these samples will exhibit such significant PL that Raman analysis is not possible. This does not mean the end of the road for the Raman spectrometer though, as the samples may exhibit different PL emissions. For example, in forgery cases, samples are likely to exhibit a high PL response as they contain fluorophores. Figure 2a shows a case of document analysis where the number 8 looks a bit suspicious. Was it always an 8, or has it been tampered with?

Figure 2: (a) white light image of an ink forgery sample, (b) false coloured PL image revealing 2 inks present in the sample and, (c) PL spectra extracted from the red and green areas of the map.
To the human eye, even under the microscope, the number 8 looks like it could be genuine and from one ink source. However, the PL map shown in Figure 2b clearly identifies two different ink sources based on their different peak wavelengths. Figure 2c shows the PL spectra extracted from the red and green regions of the map; we can see from the map how the ink represented in green was applied to turn the 3 into an 8 using the difference in PL peak position.
Read the full application note to learn more about the uses of confocal Raman microscopy for forensic analysis applications: Confocal Raman and Photoluminescence Microscopy for Forensic Investigations
Geology
Raman and PL can be used together to study geological samples, such as gemstones. They can be used in combination for the identification of the minerals present, as well as any dopants or impurities. One example is corundum, also known as aluminium oxide or alumina (Al2O3). Whilst pure corundum is colourless, it is commonly found with transition metal impurities. These impurities make corundum rocks some of the most valuable gems – ruby and sapphire.
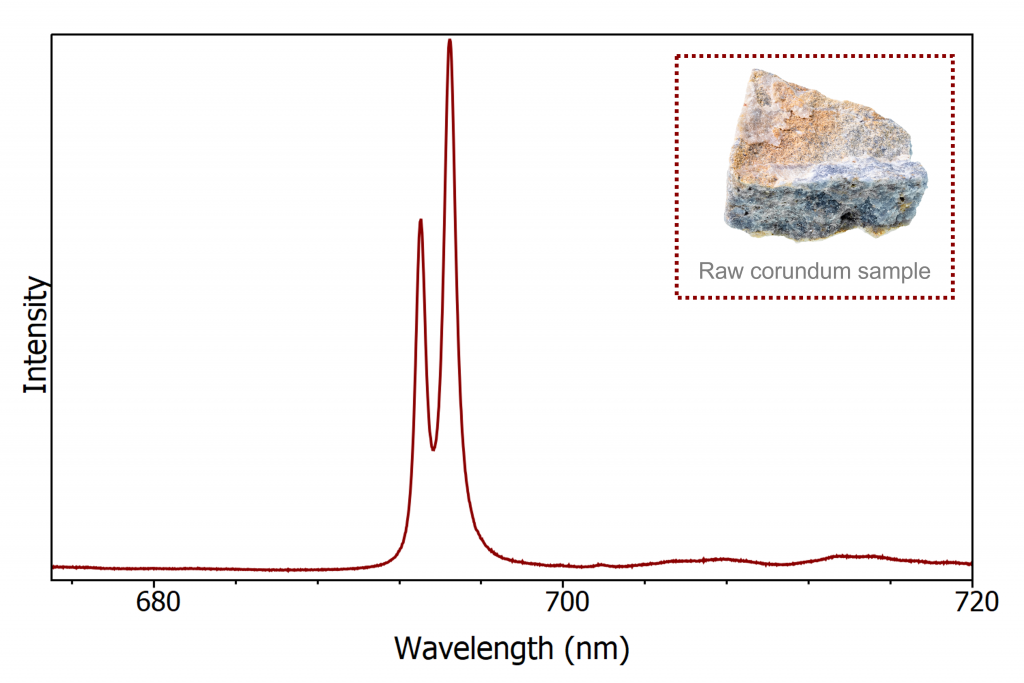
Raman can be used to characterise the host Al2O3, and the PL is used to identify the transition metal impurities. For example, chromium impurities create the strong red colour seen in rubies, this has a significant PL response which can easily be identified. Two PL peaks occur at 693.1 nm and 694.5 nm, separated by only 1.4 nm, highlighting the spectral resolution a Raman spectrometer can offer for narrow PL bands, Figure 3. Resolving these peaks is important as their individual positions are indicative of strain in the Al2O3 crystal.

Figure 3: PL spectrum of an Al2O3 crystal with Cr3+ impurities
Find out about the capabilities of the RM5 Raman Microscope for gemstone identification: Gemstone Identification Using Raman Microscopy
Conclusion
Raman and PL can be both friends and foes, by configuring your system with a range of excitation lasers you can achieve both techniques with no headaches. This can provide extremely beneficial sample information for a wide range of application areas, be it simultaneous Raman and PL, or sequential.


