Map of the Month – Carbon Nanotube Polarisation
Key Points
- Mapping can be used to visualise the changes in the Raman spectrum of a sample when an external variable, such as temperature or polarisation angle, is applied.
- Mapping is used to reveal the orientation of horizontally aligned carbon nanotubes during an angle-resolved polarised Raman microscopy study.
Welcome to Edinburgh Instruments’ blog celebrating our work in Raman, Photoluminescence, and Fluorescence Lifetime Imaging. Every month, we aim to highlight our pick for Map of the Month to show how our Raman and fluorescence spectrometers can be used to reveal all the hidden secrets in your samples.
May
In Raman spectroscopy, mapping is most commonly used to visualise the distribution of different components or the changing properties of a single material across a 2D or 3D space. Another common application of mapping is to visualise the change more clearly in the Raman spectrum of a sample when an external variable is applied to the experiment.
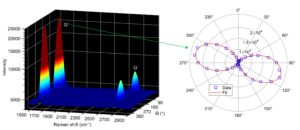
Mapping can be a compelling way to visualise changes in the spectrum over time, with changing temperature, or with alterations in the polarisation angle. In these cases, the X and Y axes of the map are the Raman shift and the external variable, respectively, and false-colour imaging indicates the intensity at each point in the map.
The images above show different methods for visualising a Raman experiment where the polarisation angle of the optics with respect to a horizontally aligned carbon nanotube sample was iteratively changed. The points of high intensity in the map could be used to reveal the alignment and orientation of the nanotubes because it suggested that the laser polarisation was lined up with the highly polarised longitudinal axis of the sample. Read our recent Application Note to learn about angle-resolved polarisation Raman microscopy works.
Contact Us


