Map of the Month – Mapping Defects in Perovskite Solar Cells
Welcome to Edinburgh Instruments’ monthly blog celebrating our work in Raman, Photoluminescence, and Fluorescence Lifetime Imaging. Every month we will highlight our pick for Map of the Month to show how our spectrometers can be used to reveal all the hidden secrets in your samples.
May
With much of the world aiming to become completely independent of fossil fuels in the near future, there is an urgent need for alternative energy sources that produce less greenhouse gas and pollutant emissions, lower the future risk of climate change, and help to mitigate economic and energy security concerns surrounding the volatility of oil and gas prices in response to geopolitical events. Solar power is an alternative energy source that converts energy from the sun into electricity. It is highly desirable because, unlike fossil fuels, the sun’s energy is infinite, and the technology is emission-free.
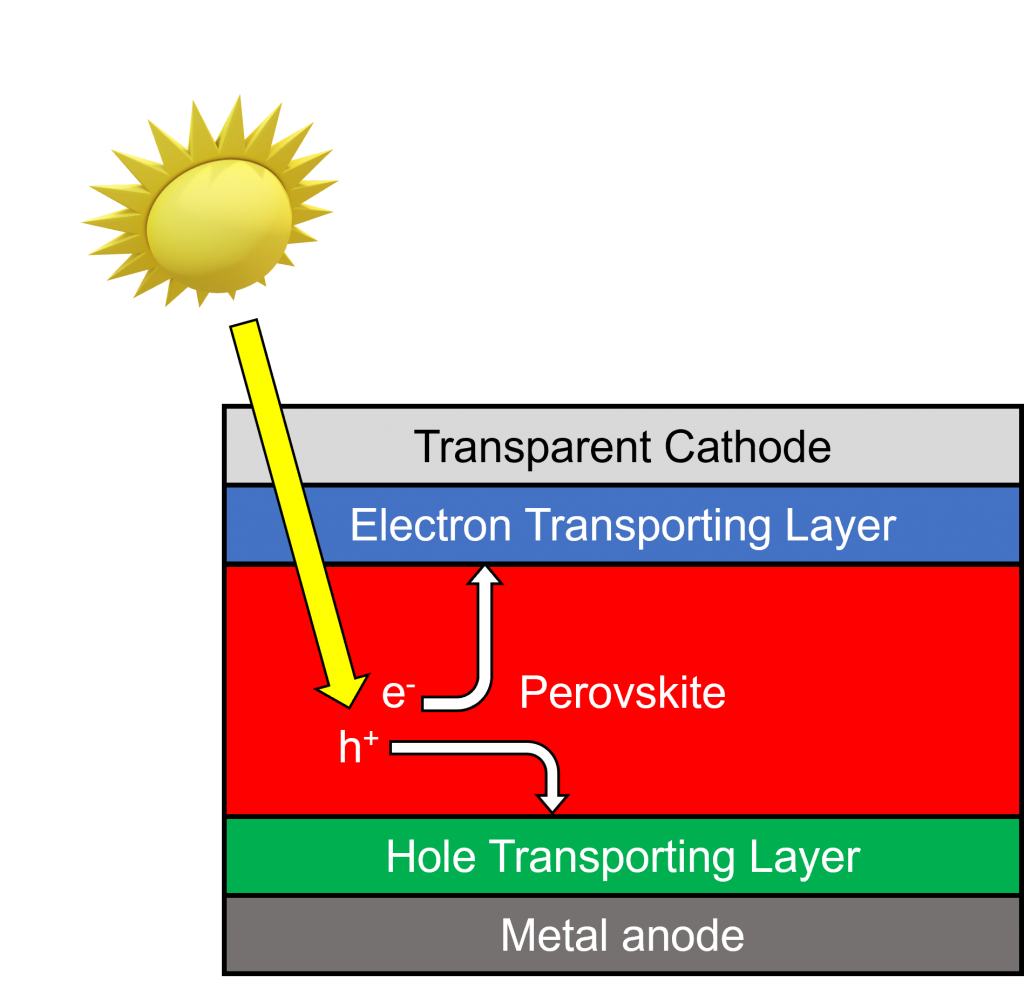
Photovoltaic cells found within solar panels rely on semiconductor materials that absorb sunlight and generate electrons that flow into conducting electrodes to produce current, Figure 1. The primary semiconductor material used in solar cells is silicon, which has the advantage of being abundant and stable, as well as having optical properties that align well with solar radiation. The disadvantage of using silicon is that the large crystals used require an expensive and complex manufacturing process that is energy intensive. Perovskites have emerged as a promising alternative to silicon because of their relatively simple and cheap additive deposition manufacturing techniques and compositional flexibility which affords a high degree of optical tunability. Improvements in perovskite photovoltaic cell efficiencies have been rapid and dramatic since they were first developed, and they are now competitive with crystalline silicon cells in that regard. However, it is also the case that perovskites are prone to suffer from defects that affect cell crystallinity, energy band alignment, and non-radiative charge recombination, all of which can reduce device performance.
Figure 1. A perovskite photovoltaic cell.
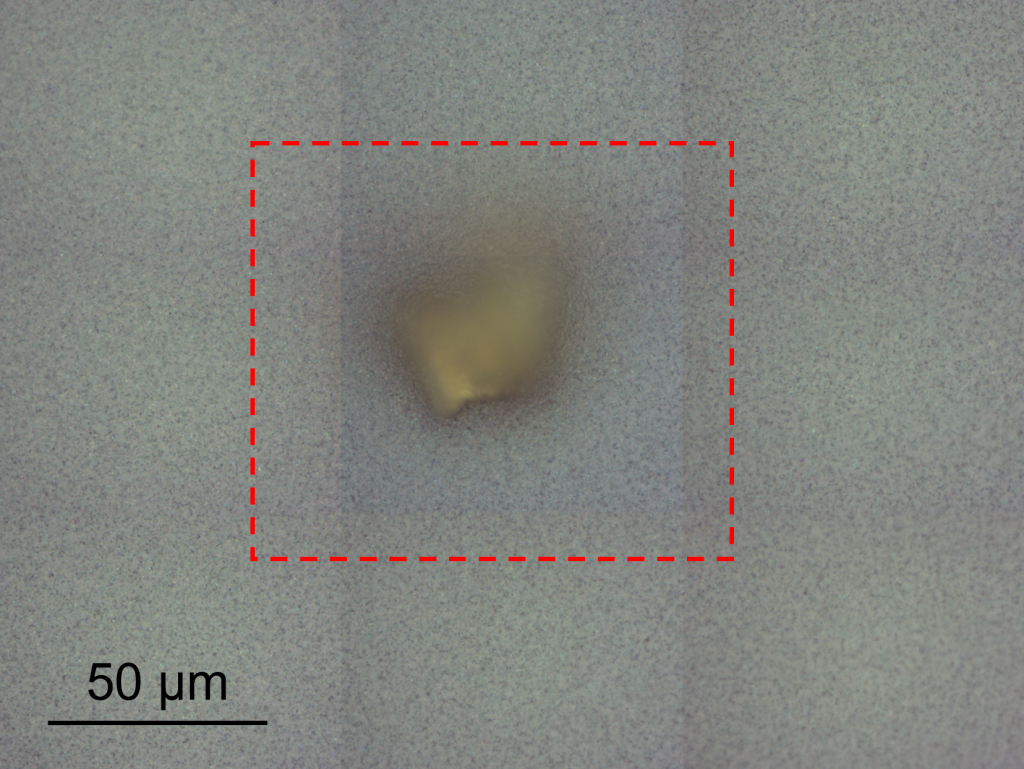
In this instalment of Map of the Month, we used the RMS1000 Raman Microscope to image the steady-state photoluminescence response, characteristic of band-to-band recombination, of a segment of a mixed halide perovskite thin film containing a suspected large defect, shown in Figure 2.

Figure 2. Stitched brightfield image of a perovskite thin film containing a suspected defect.
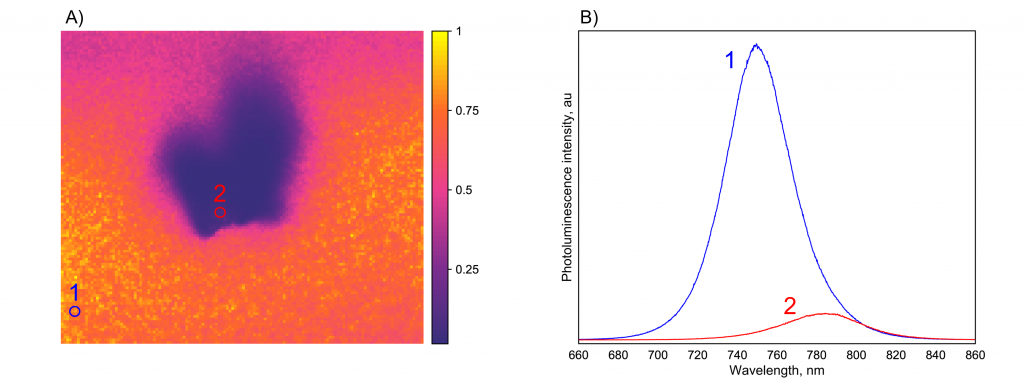
The red square around the defect in the brightfield image in Figure 2 is the area that was designated for imaging, and the resulting photoluminescence intensity map is shown in Figure 3A. It can be seen in this map that the photoluminescence emitted from the area corresponding to the suspected defect is significantly reduced in comparison to the surrounding film, which in a complete solar cell would translate to reduced power conversion. The corresponding spectra from high and low-intensity regions on the map, Figure 3B, show that the photoluminescence wavelength also shifts across the map. The difference in peak wavelength between the spectra extracted from the surrounding film and the defect structure was 34 nm, which suggests the band gap and hence the morphology of the perovskite structure is different in the two regions.

Figure 3. Photoluminescence imaging of a perovskite thin film using the RMS1000 Raman Microscope.


