Chromaticity Coordinates of Microcrystalline Phosphors
In this Technical Note, chromaticity coordinates were calculated using the FS5 Spectrofluorometers‘ integrated software package, Fluoracle®.
Luminescent materials used in lighting are standardized by the International Commission on Illumination (CIE). This standardisation is important for the lighting industry and is based on the illuminating conditions, the brightness and the observer.
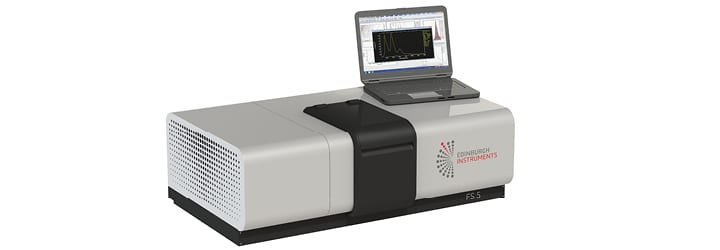
FS5 Spectrofluorometer from Edinburgh Instruments.
CIE Chromaticity Coordinates
The tri-stimulus functions of an observer are defined as1 :
where I (λ) is the spectral intensity of the material, while x(λ), y (λ), z (λ) are the chromatic functions of the observer as defined by CIE2. It can be noted that the limits of the integrals can be any real integer. However, the functions are intended for standardisation in the visible range which corresponds to the photopic vision of a human observer, i.e. 380 nm to 780 nm.
Consequently, the normalised chromaticity x and brightness y coordinates are calculated according to CIE 1931 standard as1 :
According to the latest CIE 1976 standard the u’ and v’ coordinates are defined as3 :
Results
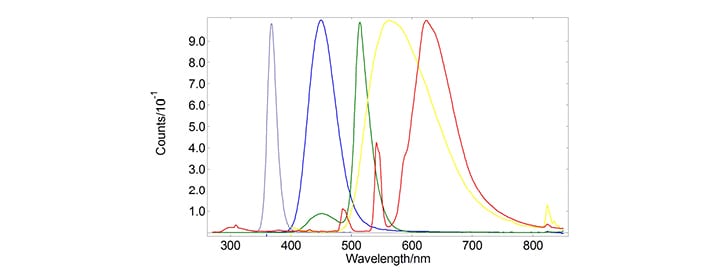
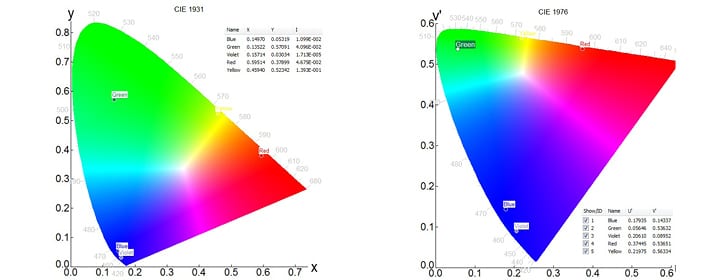
The emission spectra of the phosphors excited at 254 nm are displayed in Figure 1. From the spectra of Figure 1, the chromaticity coordinates could be directly calculated in Fluoracle®. The coordinates are displayed in CIE 1931 and CIE 1976 diagrams in Figures 2 and 3, respectively.
Figure 1: Emission spectra of six representative phosphors commonly used in LED.
Figure 2 (left): Chromaticity diagram and coordinates of the phosphors of Figure 1 according to CIE 1931. Figure 3 (right): Chromaticity diagram and coordinates of the phosphors of Figure 1 according to CIE 1976.
Chromaticity coordinates, important for the characterization of luminescent materials in the lighting industry can be fully characterised in an FS5 Spectrofluorometer. The coordinates are directly calculated in the operating software of the spectrometer, thereby simplifying and automating the measurement process. Additional geometries including excitation normal to the sample’s surface or integrating spheres can also be readily used in the spectrometer for materials with extraordinary radiance patterns.
References
1. Smith, T. & Guild, J. The C.I.E. colorimetric standards and their use. Trans. Opt. Soc. 33, 73 (1931).
2. Schanda, J. in Colorimetry (ed. President, J. S. S. of the C. V. P. chairs) 25–78 (John Wiley & Sons, Inc., 2007).
3. McLaren, K. XIII—The Development of the CIE 1976 (L* a* b*) Uniform Colour Space and Colour-difference Formula. Journal of the Society of Dyers and Colourists 92, 338–341 (1976).
Instruments and Procedure for Chromaticity Coordinates
Spectral measurements were made in an FS5 Spectrofluorometer in its standard configuration, equipped with a 150 W xenon lamp and a single photon photomultiplier tube (PMT) detector (Hamamatsu, R928P). Phosphor powder samples were clamped in 2 mm demountable cuvettes and measured in a 45° front-face configuration with the SC-10 cassette of the FS5. This geometry closely matches the CIE recommended directional geometries3. Spectral correction was applied post-measurement to obtain the pure spectra of the phosphors. The chromaticity coordinates
were calculated using the built-in chromaticity wizard of the Fluoracle® software package.
For more information on the FS5 Spectrofluorometer, contact a member of our sales team at sales@edinst.com.
Download the full Technical Note on Chromaticity Coordinates
Chromaticity Coordinates of Microcrystalline Phosphors
Stay in Touch
If you have enjoyed reading this Technical Note, and want to be the first to see that latest news, applications, and product information from Edinburgh Instruments, sign-up to our infrequent newsletter via the red sign-up button below, and follow us on social media.


