Ramacle® Software Highlight: Surface Mapping
The Surface Mapping feature of Ramacle® enables the user to analyse difficult samples with rough and uneven surfaces by keeping the laser perfectly focused on the sample surface throughout the Raman map.
The Ideal Scenario
In standard Raman mapping the laser is focussed on the surface of the sample and rastered across the surface of the sample. Raman scatter is collected from each X-Y point, to give a Raman map showing the sample composition. An ideal sample will be perfectly flat, meaning the laser remains in focus in the Z-axis throughout the entire map, Figure 1, and any spectral difference in the Raman map can be attributed to sample variation.
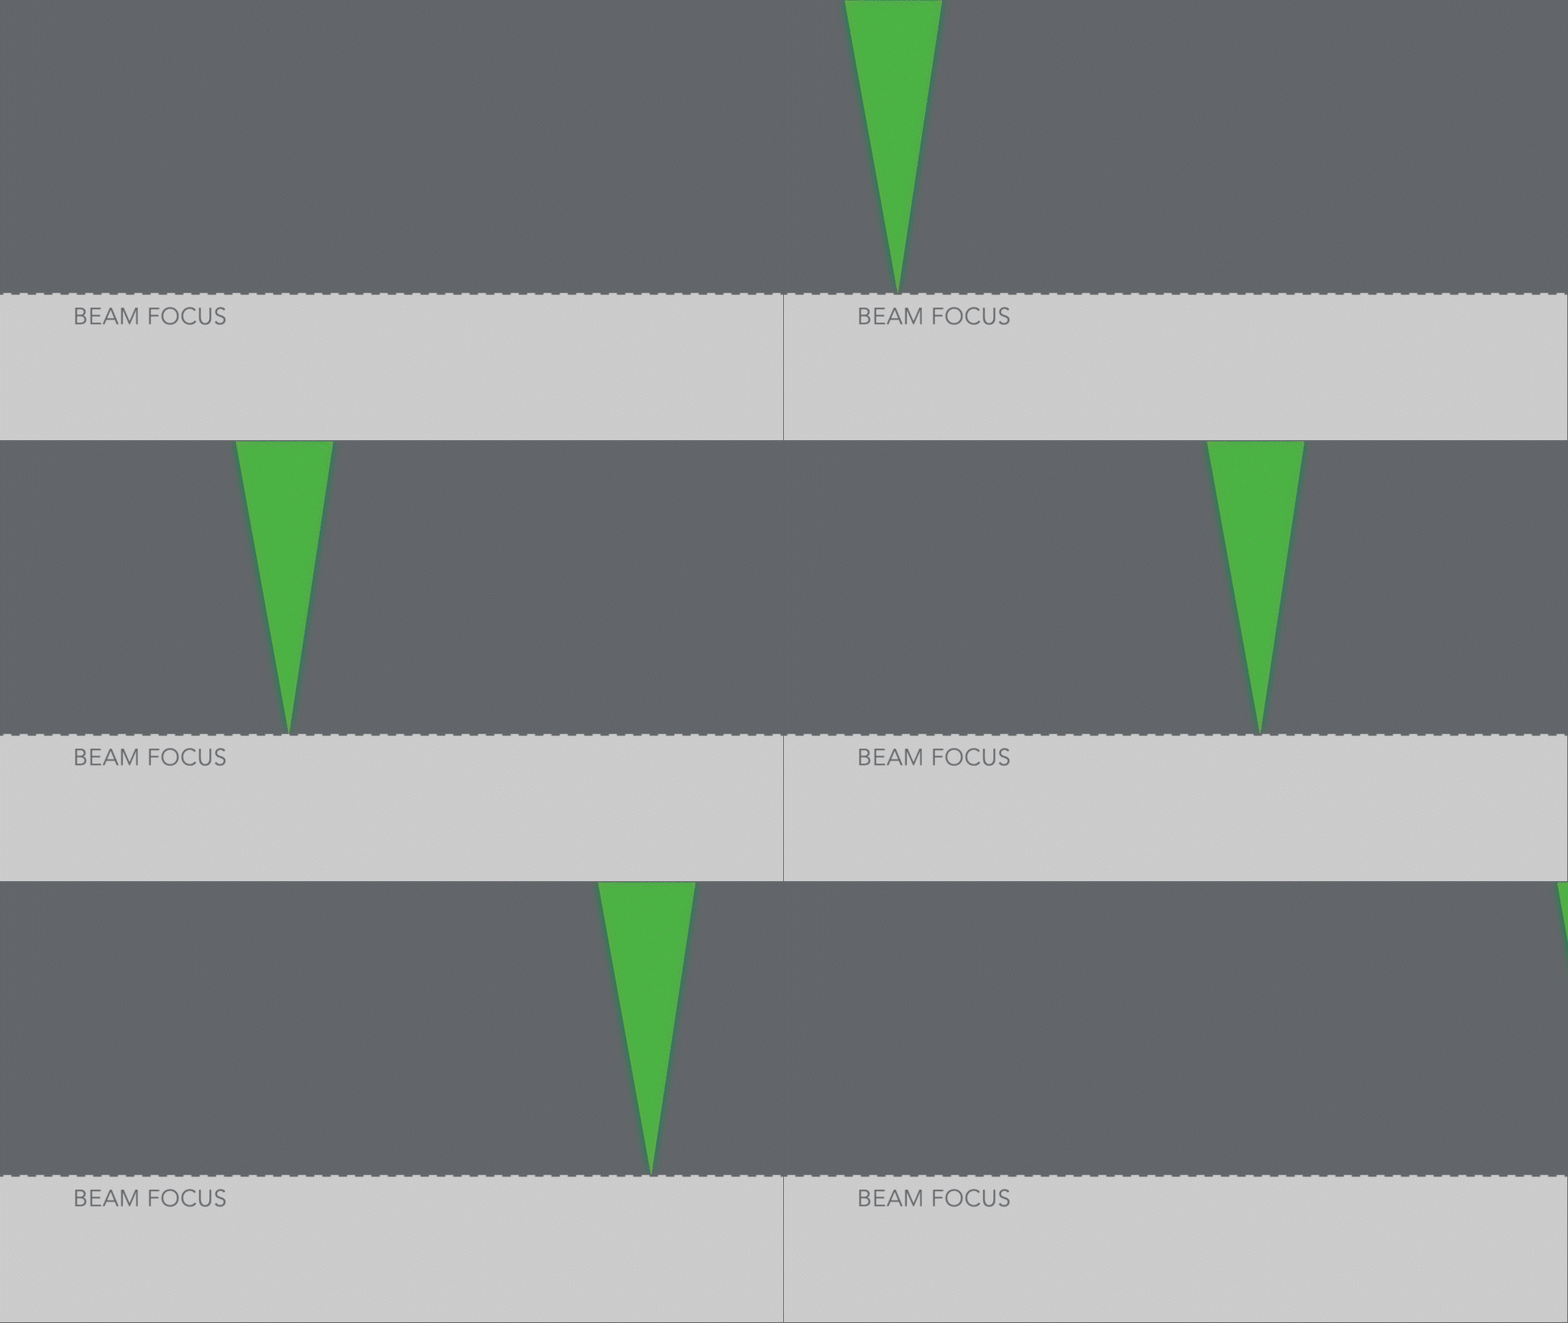
Figure 1: Laser focus in standard mapping on a flat surface.
The Problem
In reality, most samples are not truly flat, they may have a rough surface or be tilted in nature. In these samples, as the Raman map is being acquired the laser will not be in focus at all points. When the laser is not in focus in the Z-axis the laser spot will become larger, Figure 2, resulting in lower Raman intensity and reduced spatial resolution.

Figure 2: Laser focus across a sample with an uneven surface.
For example, a pharmaceutical tablet with a dip in the centre, using standard mapping the middle of the tablet will be out of focus. A spectrum from a point in the focused area (yellow cross) will have significantly higher Raman intensity than a spectrum taken in the out of focus dip (blue cross), Figure 3. The difference in intensity between the two spectra is not due to sample variation but out of focus measurements.
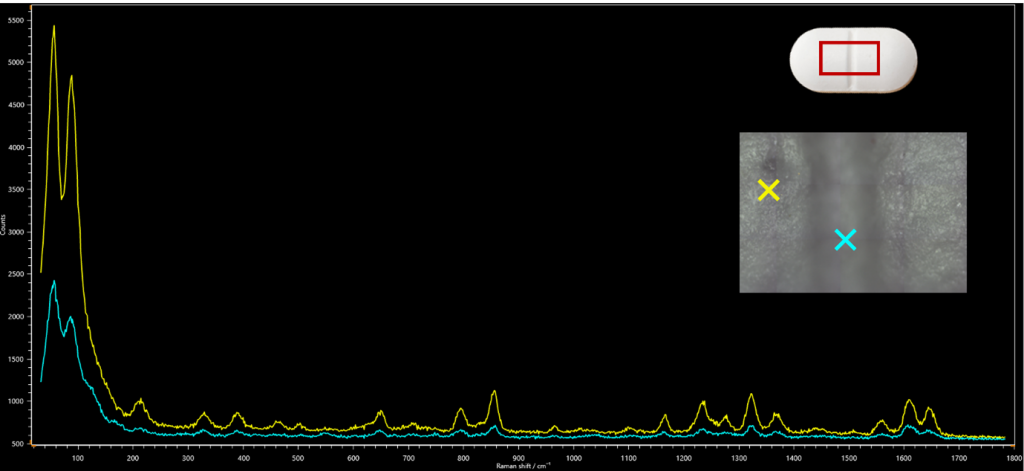
Figure 3: Raman spectra from a pharmaceutical tablet focused in Z (yellow), out of focus (blue).
The Solution
Step 1: Building the Surface Image
Surface Mapping is used to overcome the issue of out of focus Z measurements. First, a Surface Image is built. Here, the user defines a near and far Z-point that encompasses the surface height variation of the sample, Figure 4.

Figure 4: Far and near Z-points on an uneven surface.
A series of white light images are taken at user-defined Z-points, for this pharmaceutical tablet the height variation is roughly 520 µm, and Z-stack images were taken every 20 µm. These Z-stack images are processed by Ramacle® creating one image that is optimally focused at all X-Y points, Figure 5(b). Ramacle® now had the focused Z-coordinate for each X-Y point stored, the 3D topography view of the sample shows the Z-variance, Figure 5(c).
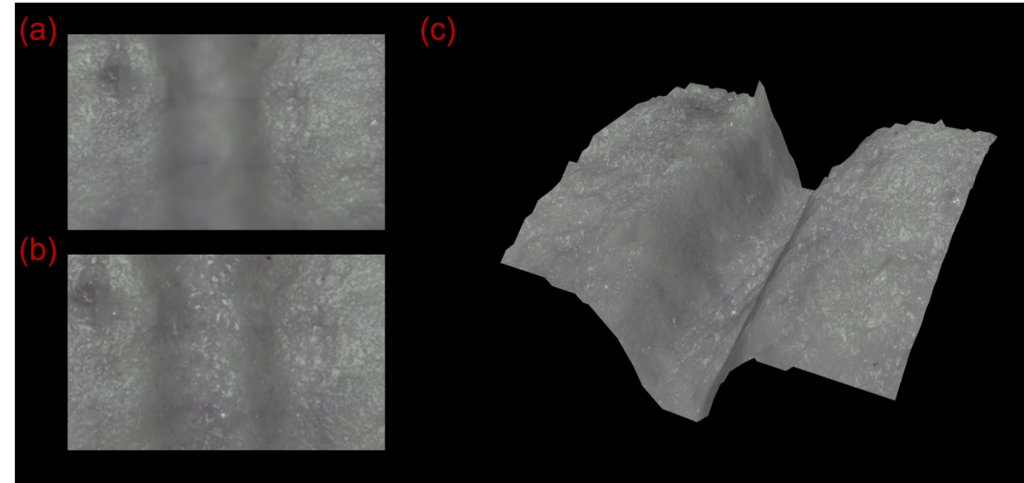
Figure 5: (a) Out of focus white light image at a single Z point, (b) 2D representation of a Surface Image (c) 3D topography view of a Surface Image.
Step 2: Raman Mapping the Surface
Next, the Raman Surface Map is acquired, using the focussed Z-coordinates obtained from the Surface Image. At each X-Y point Ramacle® will adjust the stage Z-position to keep the sample in focus, Figure 6, ensuring the sample remains in perfect focus throughout the entire acquisition.
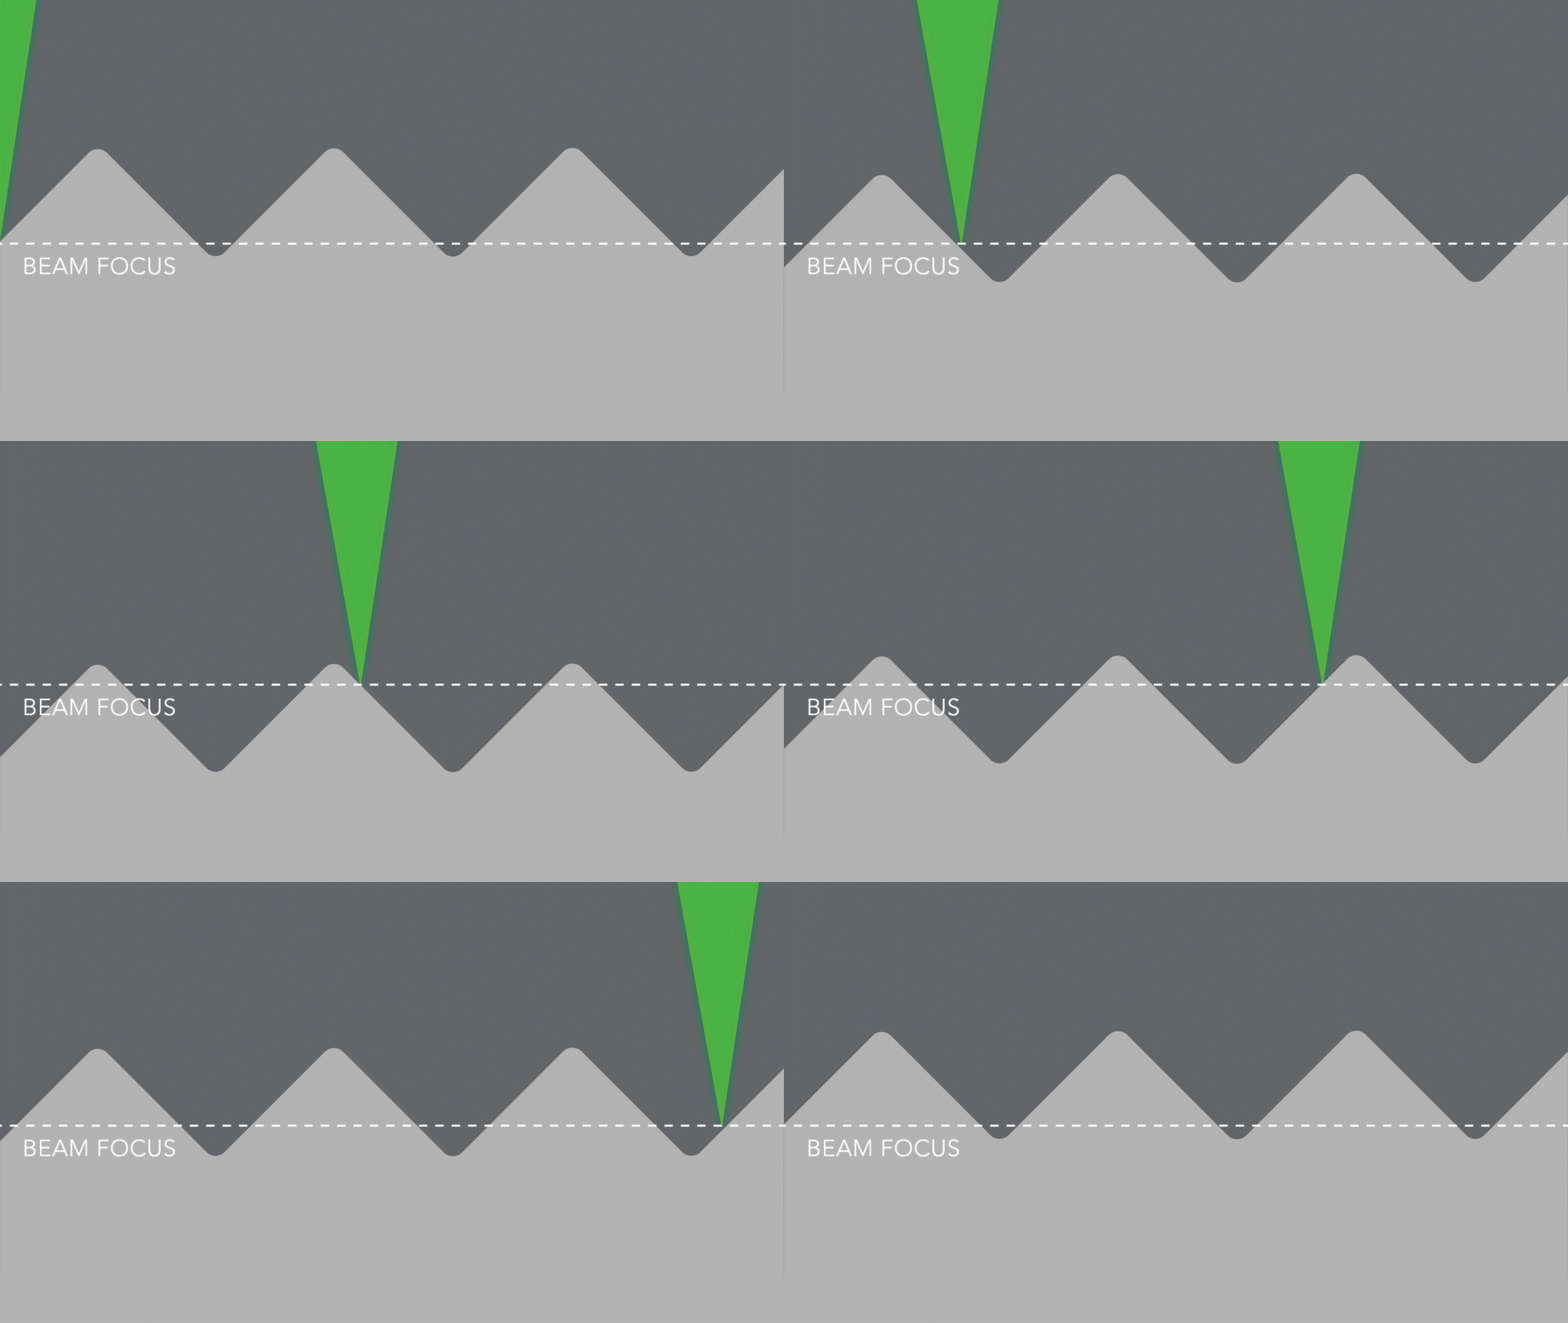
Figure 6: Laser focus across an uneven surface during Surface Mapping.
The resulting map can be displayed in 3D showing the sample height variation and, in this example, reveals the distribution of paracetamol (blue), aspirin (coral), and caffeine (green) in the tablet, Figure 7.
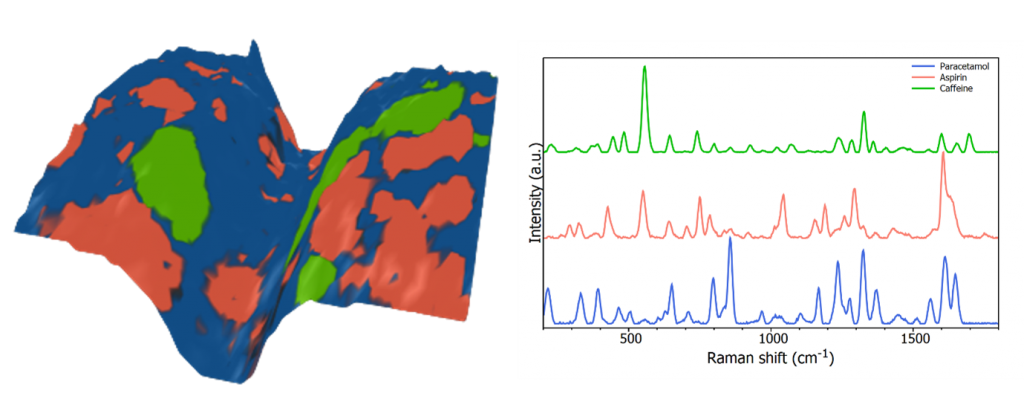
Figure 7: 3D topography view of a pharmaceutical tablet false coloured (left) and its spectra (right). Paracetamol shown in blue, aspirin in coral, and caffeine in green.
Conclusion
Surface Mapping enables the user to obtain high quality Raman maps from rough and uneven sample surfaces. Whilst this example focuses on a Raman Surface Map, Surface Mapping can be used with our FLIM upgrade on the RMS1000 Raman and Photoluminescence Microscope, and with our Micro-PL upgrade for the FS5 and FLS1000 spectrofluorometers.
Download & Contact Us
Download the Software Highlight: Ramacle® Surface Mapping, if you have any more questions on surface mapping or would like to see it in action in a live demo on your samples a member of our sales team would be happy to discuss it further.


