What is FLIM – Fluorescence Lifetime Imaging Microscopy?
Key Points
- Fluorescence lifetime imaging microscopy (FLIM) measures the variation in fluorescence lifetime across a sample
- FLIM images are recorded using a pulsed laser source and time-correlated single photon counting (TCSPC) electronics coupled to a confocal microscope
- Fluorescence lifetime provides an additional dimension of information not available with conventional fluorescence intensity imaging
Why use FLIM?
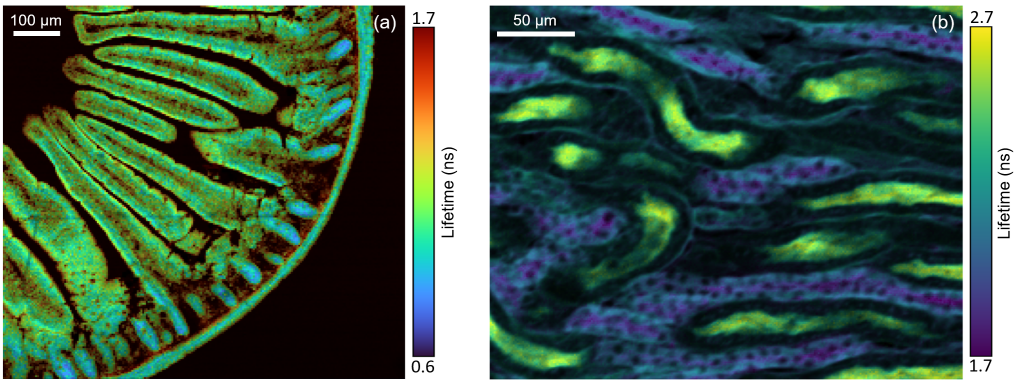
Fluorescence lifetime imaging microscopy (FLIM) is an imaging technique where the fluorescence lifetime variation across the sample creates the contrast in the image (Figure 1). FLIM is widely used in biomedical imaging, where tissue and cells are stained with one or more fluorescent dyes. The dyes’ fluorescence lifetime depends on the local micro-environment, and FLIM provides an additional dimension of environmental information over other imaging techniques such as widefield fluorescence. FLIM is also increasingly used to study intrinsically fluorescent (photoluminescent) materials such as imaging the variation in carrier lifetime of nanomaterials, solar cells, and semiconductors.
 Figure 1: FLIM images of (a) mouse intestine section and (b) mouse kidney section measured using the Edinburgh Instruments RMS1000 Confocal Microscope.
FLIM Confocal Microscope
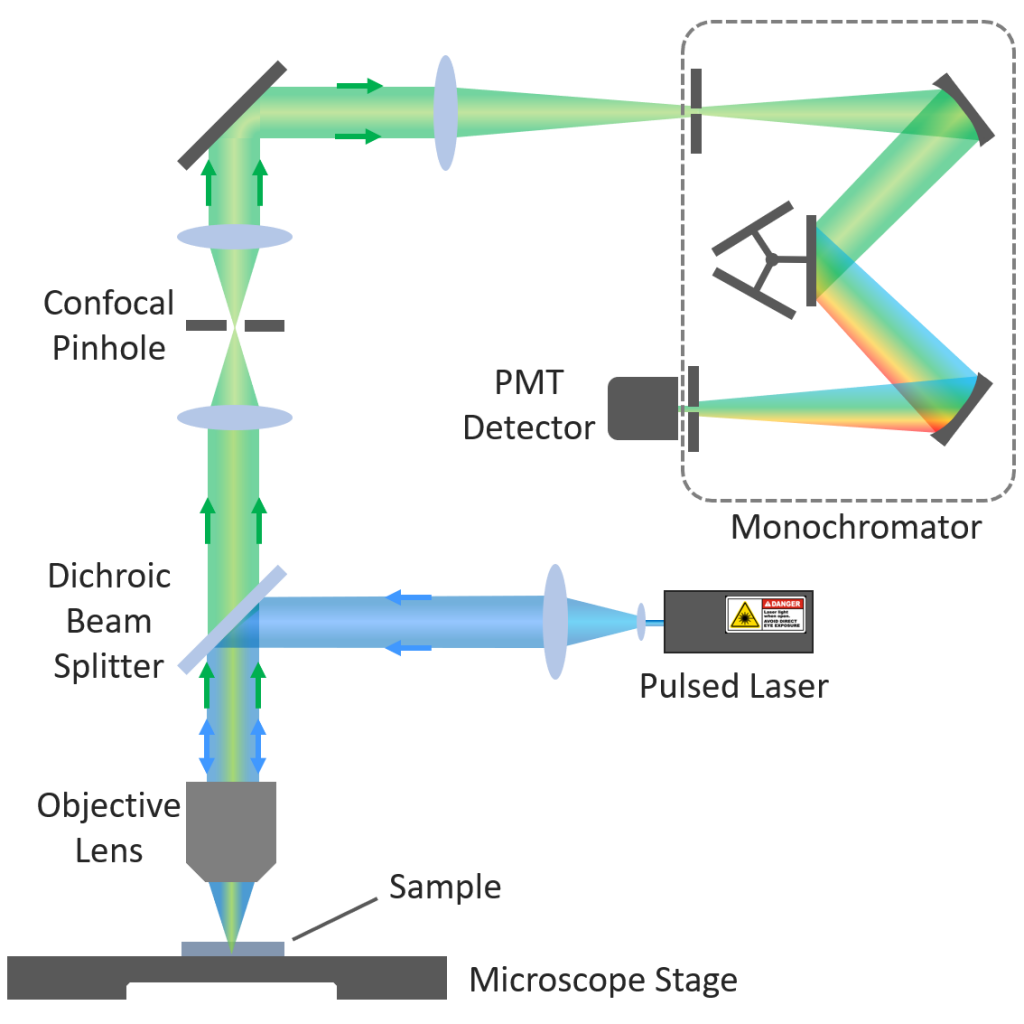
FLIM images are acquired using a confocal microscope arrangement (Figure 2). The microscope is equipped with a pulsed laser excitation source and the laser light is focused by the objective lens to a small spot on the sample. The fluorescence from the sample is wavelength selected using either a filter or a monochromator (Figure 2 arrangement) and detected using a single photon counting detector such as a photomultiplier tube (PMT).

Figure 2: FLIM Confocal Microscope.
FLIM Acquisition
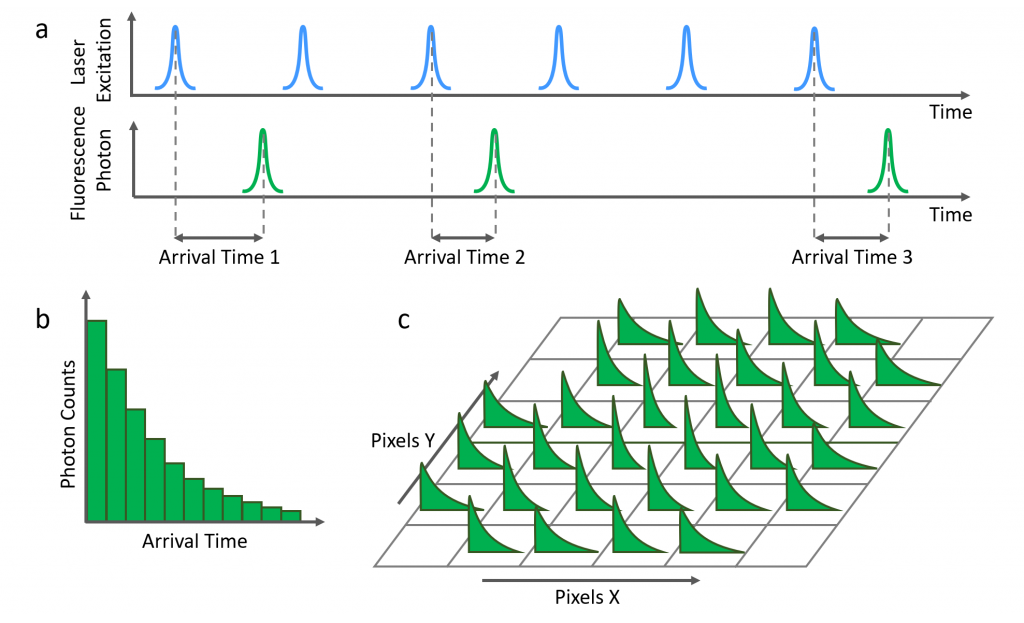
Fluorescence decays are acquired using time-correlated single photon counting (TCSPC). In TCSPC a pulsed laser is used to excite the sample and the time between the laser pulse and the detected fluorescence photon is measured (Figure 3a). This process is repeated millions of times to create a histogram of fluorescence photon counts versus arrival time (Figure 3b).
The area of interest on the sample is split into pixels and the fluorescence decay from each pixel is recorded using TCSPC (Figure 3c). The laser spot is directed onto each pixel by moving the microscope stage (stage scanning) or the excitation laser spot (laser scanning). This process occurs sequentially, with the decay from each pixel recorded in turn to build a dataset of histograms pixel by pixel.

Figure 3: a) Fluorescence photon arrival times are recorded photon by photon using TCSPC. b) Fluorescence decay histogram from a single pixel. c) Fluorescence decay histograms are recorded pixel by pixel across the area of interest.
FLIM Analysis
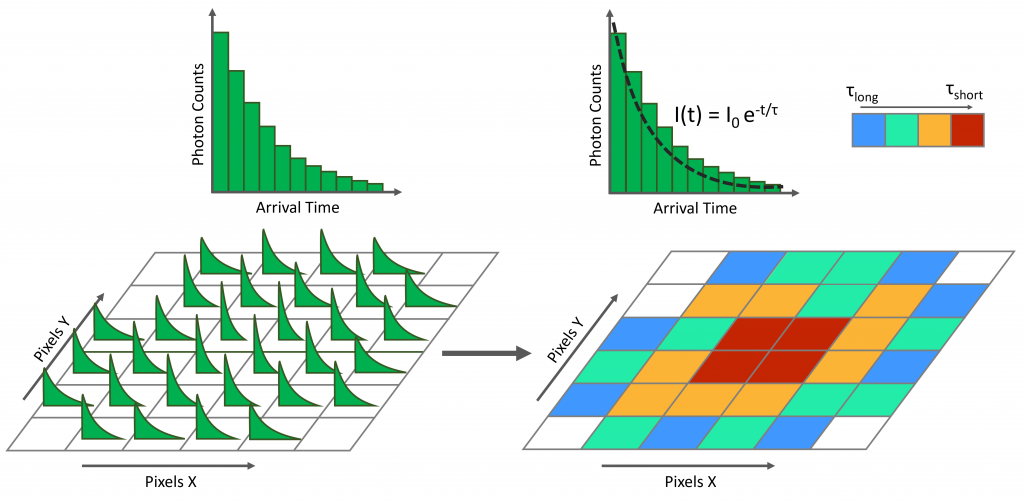
The fluorescence lifetime of each fluorescence decay histogram in the dataset is calculated. This is most often calculated by least squares fitting a single exponential model to each decay to obtain the fluorescence lifetime τ (Figure 4). The range of fluorescence lifetimes obtained from the fitting is mapped onto a colour map to create a colour-coded fluorescence lifetime image.

Figure 4: The fluorescence lifetime of each pixel in the FLIM dataset is calculated and colour mapped to create a colour-coded fluorescence lifetime image.


