Photophysical Characterisation of Perovskite Quantum Dots
Perovskite Quantum Dots are a promising new class of light emitters. In this application note a complete photophysical characterisation, comprising of absorption spectra, photoluminescence spectra, photoluminescence lifetime, and quantum yield of two perovskite quantum dots is carried out using the versatile FS5 Spectrofluorometer.
Introduction
Semiconductor quantum dots possess an array of attractive properties, including; high photoluminescence quantum yields (PLQY), solution processability and highly tuneable band gaps. These properties make quantum dots ideal for optoelectronic devices such as light emitting diodes and semiconductor lasers where they serve as emitters or in photodiodes and solar cells where they serve equally well as light absorbers. In addition, their light emission properties also make them a promising new class of fluorescent probe for biomedical fluorescence imaging to replace traditional organic small molecule probes.
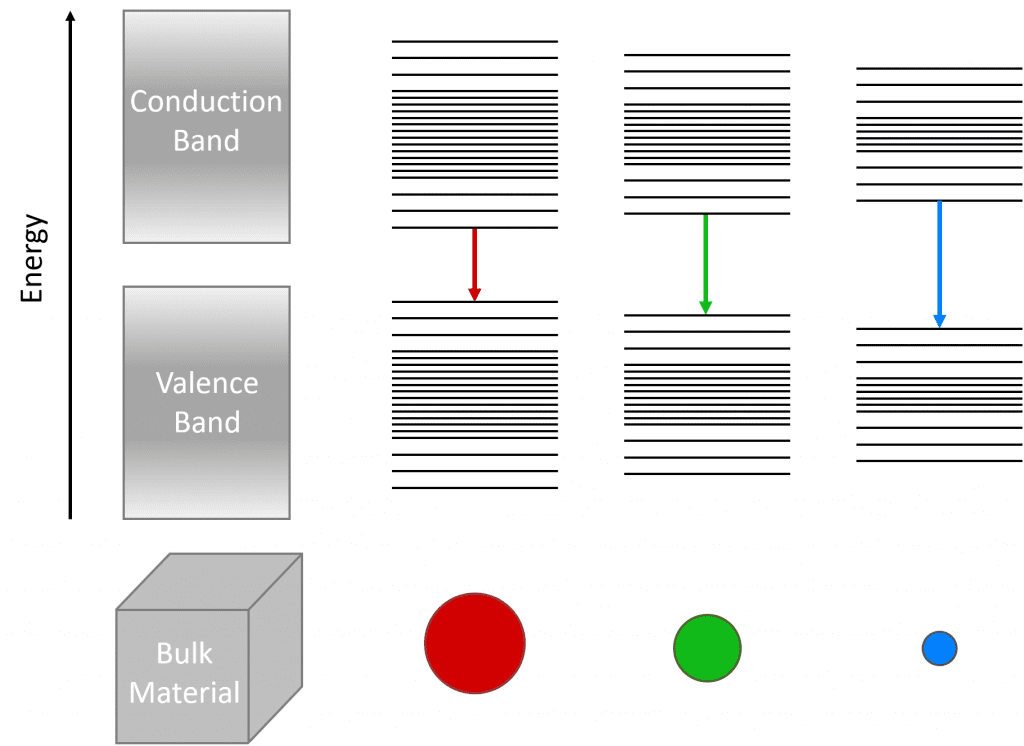
The key attraction of quantum dots is the superb control available over their band gap due to quantum confinement. In a bulk semiconductor the number of atoms is very large and the overlap of this high number of atomic orbitals creates a continuum of closely spaced ‘molecular’ orbitals which form the valence and conduction bands. However, if the semiconductor is reduced to a nanoscale size the situation changes. There are fewer atomic orbitals overlapping and the valence and conduction bands are no longer continuous and are instead formed of discrete energy levels, and more importantly the band gap between the valence and conduction bands becomes wider which is known as quantum confinement (Figure 1). Nanoparticles that are small enough to have their band gap influenced by quantum confinement are known as quantum dots and by precisely controlling the size of the quantum dots during synthesis the photoluminescence emission and absorption wavelengths can be finely tuned, which is ideal for optoelectronic applications.

Figure 1: The influence of particle size on the band gap and photoluminescence emission wavelength of quantum dots due to quantum confinement.
Quantum dots have been traditionally dominated by the chalcogenides such as cadmium telluride and zinc selenide. Recently, quantum dots based on halide perovskite semiconductors have been attracting increasing attention. Halide perovskites have already received widespread attention in the scientific community for their role as low cost, high efficiency absorbers in photovoltaic cells. The solution processability, band gap tuneability and high PLQY that has led to the success of perovskite solar cells also make them promising candidates as a new class of quantum dots. Further research is required to improve the properties of perovskite quantum dots and the primary techniques to characterise these materials are photoluminescence and absorption spectroscopy.

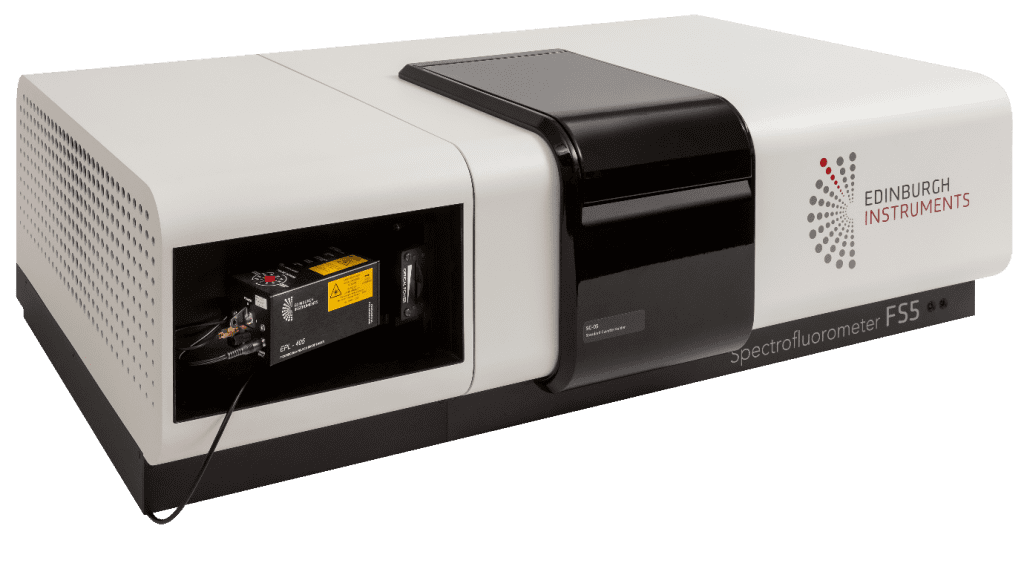
Figure 2: The FS5 Spectrofluorometer with TCSPC electronics and pulsed diode laser. The FS5 can be configured to measure the absorption spectra, emission spectra, lifetime and quantum yield of materials such as perovskite quantum dots.
Materials & Methods
Perovskite quantum dots were purchased from PlasmaChem GmbH. A solution of each quantum dot was prepared in cyclohexane and diluted to achieve an absorbance of 0.1 OD at the band edge in order to prevent reabsorption errors during spectral and PLQY measurements. The solutions were loaded into 10 mm pathlength quartz cuvettes and measured using the FS5 Spectrofluorometer equipped with a PMT-900 detector and TCSPC lifetime electronics. For absorption spectra, photoluminescence emission spectra and photoluminescence decays the cuvettes were held using the SC-05 Cuvette Holder Module. To calculate the PLQY the quantum dots were measured using the SC-30 Integrating Sphere Module.
Results & Discussion
The photophysics of two halide perovskite quantum dots, henceforth known as PQD-A and PQD B, were investigated using the FS5 Spectrofluorometer. The FS5 contains an absorption detector as standard which enables the photoluminescence and absorption spectra to be measured using a single instrument. The absorption and emission spectra of PQD-A are shown in Figure 3a. The emission is centred on 450 nm and is characteristically narrow with a FWHM of only 14 nm. It can be seen that the emission occurs at the band edge of the quantum dot as the emission peak is coincident with the sharp drop in the absorbance that marks the band edge. The absorption and emission spectra of PQD-B tell a similar story with a narrow emission centred on 514 nm at the band edge of the quantum dot. However, the absorption behaviour of PQD-B and PQD-A are quite different. In PQD A the absorbance falls sharply to zero at the band edge as is expected for a semiconductor. In contrast, the absorbance of PQD-B does not fall completely to zero at the band edge and instead there is a long exponential decay in the absorbance following the band edge. This gradual decay is known as an Urbach tail and arises from higher energetic disorder at the band edge due to defects and trapping sites.1-3 The absorption spectra therefore suggest the energetic disorder in PQD-B is significantly higher than in PQD-A. For display applications it is more useful to describe the emission in terms of its’s chromaticity coordinates rather than the peak wavelength. The Fluoracle® software of the FS5 has a built-in wizard to generate a chromaticity plot from any emission spectrum, in either CIE 1931 or CIE 1976 colour space. The chromaticity coordinates of the two quantum dots were calculated in CIE 1931 colour space and are shown in Figure 3c.

Figure 3: Absorption and emission of perovskite quantum dots in cyclohexane. (a) Absorption and emission spectra of PQD A, (b) absorption and emission spectra of PQD-B and (c) chromacity coordinates of the PQD-A and PQD-B emission. The excitation source for the absorption and emission measurements was a 150 W Xenon Lamp. Absorption spectra parameters: Δλex = 2 nm. Emission spectra parameters: λex = 350 nm, Δλex = 1.0 nm, Δλem = 0.5 nm.
A high PLQY is critical for all perovskite quantum dot applications. For quantum dot emitters a high PLQY will result in brighter emission for a given input of energy. While for quantum dot absorbers in solar cells, higher PLQYs will result in higher open circuit voltages and greater power conversion efficiencies. Accurate measurement and optimisation of the PLQY of newly developed perovskite quantum dots is therefore crucial. The most reliable method to measure the PLQY of a sample is to use an integrating sphere. The scattering and emission peaks of PQD-A, PQD B and the cyclohexane solvent were therefore measured using the SC-30 Integrating Sphere Module for the FS5 and are shown in Figure 4.

Figure 4: The scattering and emission peaks of PQD-A and PQD-B dissolved in cyclohexane along with a reference of pure cyclohexane solvent. The scattering and emission integration ranges that were used to calculate the PLQY are shown in red. Excitation source = 150 W Xenon Lamp, λex = 350 nm, Δλex = 5 nm, Δλem = 0.3 nm.
The PLQY of the quantum dots was calculated using the built-in quantum yield wizard of Fluoracle. In the wizard the desired scattering and emission integration ranges are defined, and Fluoracle then integrates over the reference and sample spectra and calculates the quantum yield using,

where SSample and SRef are the integrated intensities of the scattering peaks of the sample and reference respectively, ESample is the integrated intensity of the sample emission and ERef Scaled is the integrated intensity of the scaled reference emission. The scaled reference emission is to account for higher intensity of scattered light in the sphere when the weakly absorbing reference is present. This higher scattering intensity causes a higher background emission signal in the sphere compared to when an absorbing sample is present. Fluoracle therefore contains the option to automatically scale the background emission by the ratio of sample and reference scattering peak heights, which results in the scaled reference background shown in grey in Figure 4 and results in a more accurate background subtraction for the PLQY calculation. PQD-A was found to have a poor PLQY of 3.3% while PQD-B has an excellent PLQY of 56.0%. The value of 56.0% for PQD-B highlights the promise of these new materials and recently PLQY values for similar perovskite quantum dots of over 90% have been reported in the literature which is comparable to traditional cadmium based dots.4
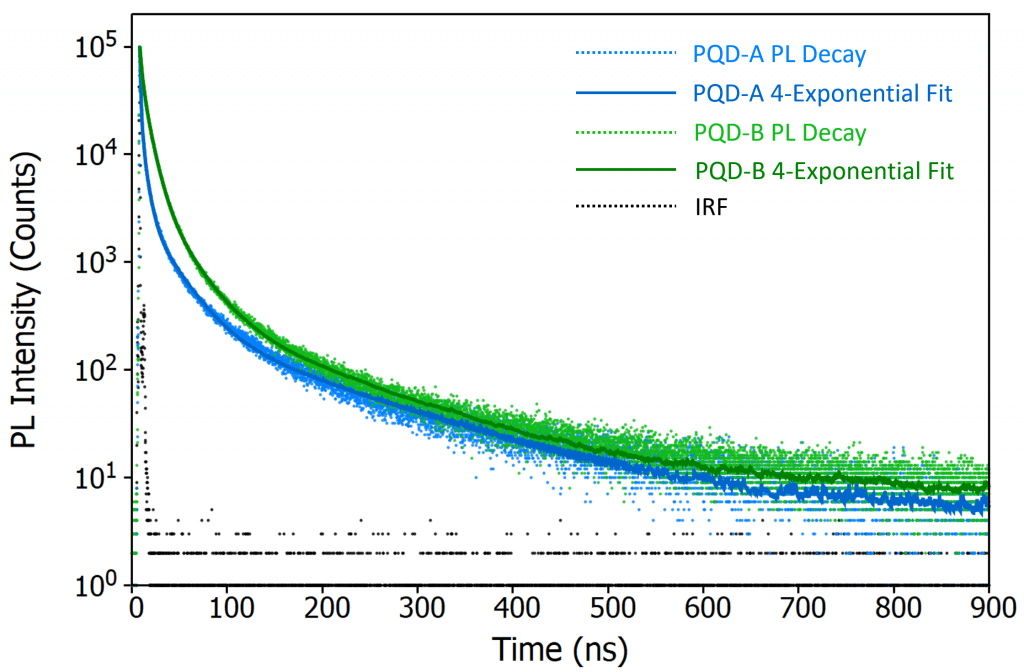
The final photophysical parameter that is important for the characterisation of perovskite quantum dots is the photoluminescence lifetime which provides information on the nature of the recombination processes inside the quantum dot. The PL decays of PQD-A and PQD B were measured using Time-Correlated Single Photon Counting (TCSPC) and are shown in Figure 5. The PL decays were found to be highly complex and cannot be fit with a single time constant which is consistent with previous reports.4 The complex decay behaviour is likely due to multiple recombination processes occurring within the quantum dot such radiative and non-radiative recombination channels and the fact there will be a distribution of dots each with slightly different lifetimes. The PL decays were fit with a four component exponential decay model (Eq. 2) using Fluoracle’s inbuilt reconvolution fitting routine. Reconvolution fitting takes into account the pulse shape of the excitation laser and the detector response to provide a more reliable fit.

Figure 5: PL decays of PQD-A and PQD-B measured using TCSPC. The samples were excited at 405 nm using a pulsed diode laser (EPL-405). The PL decays were fit using a 4-Exponential model using reconvolution fitting with the IRF of the laser pulse. λex = 405 nm, Δλem = 1 nm, λem = 450, 514 nm.
The PL decays were fit with a four component exponential decay model (Eq. 2) using Fluoracle’s inbuilt reconvolution fitting routine. Reconvolution fitting takes into account the pulse shape of the excitation laser and the detector response to provide a more reliable fit.
Table 1: Fitting parameters of the PL decays in Figure 5
The results of the fit for PQD-A and PQD-B are shown in Table 1.The four components of the exponential fit almost certainly do not correspond to four discrete physical processes but can instead be used to calculate the average lifetime of the decay, 〈τ〉, which then serves a figure of merit for each quantum dot. The average lifetime of the decays was calculated using Eq. 3 and were found to be 16.1 ns and 19.1 ns for PQD-A and PQD-B respectively.
Conclusion
The photophysics of two perovskite quantum dots were investigated using the FS5 Spectrofluorometer. The absorption and emission spectra of the dots were measured which revealed peak emission wavelengths at 450 nm and 514 nm that coincided with the band edge of the dots. Using the SC-30 Integrating Sphere Module the PLQY was calculated, with the 450 nm emitting dot found to have a poor PLQY of only 3% while the 514 nm emitting dot had an excellent PLQY of 56%. Lastly, the PL lifetimes of the dots were investigated using TCSPC, revealing complex recombination behaviour with average lifetimes of 16.1 ns and 19.1 ns. This application note highlights the capability of the FS5 Spectrofluorometer to provide a complete photophysical characterisation of quantum dot emitters in a single compact instrument.
References


