Luminescence Thermometry with Upconversion Materials
Many upconversion luminescent materials emissive properties change as a function of temperature, pressure, or the presence of a chemical species. Such properties have long been exploited in the development of luminescence-based sensors. Besides chemical sensing, luminescence thermometry is one of the most popular types of sensing. Unlike other methods, it does not require physical contact of a macroscopic probe with the region of interest. This is a huge advantage when access to the sample is difficult, and also in microscopy and biological samples. For example, luminescent nanoparticles can be functionalised to enter a biological target, and fluorescence microscopy can be used to accurately probe the temperature in different areas. This kind of nanometric thermometry has a lot of potential in the medical field, for example imaging cancer cells which have higher temperatures than the average.
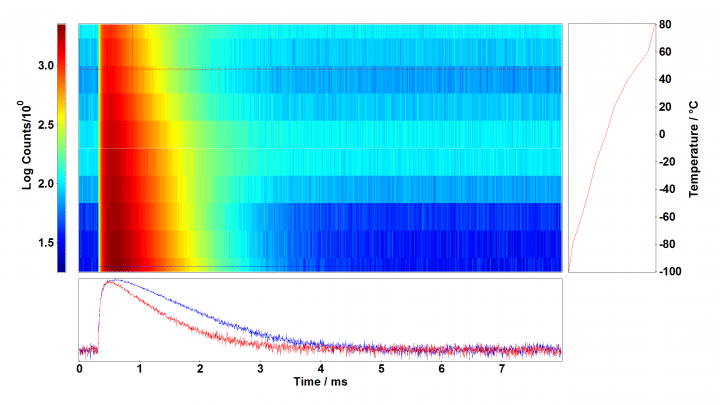
Figure 1: Temperature lifetime map of NaY0.77Yb0.20Er0.03F4 measured with Linkam stage in FLS1000, 2H11/2 → 4I15/2 emission. Conditions: λex = 980 nm, Δλex = 15 nm, λem = 541 nm, Δλem = 10 nm, repetition rate = 100 Hz, acquisition time = 5 minutes/decay. The red and blue curves show the decays at -100 °C and 40 °C, respectively.
Materials and Methods for Luminescence Thermometry
A commercial upconversion phosphor, NaY0.77Yb0.20Er0.03F4 (Sigma Aldrich) was placed as supplied in a quartz tray inside a Linkam HFS350EV-PB4 stage. The stage was optically coupled to an FLS1000 Photoluminescence Spectrometer by means of a custom mount (N-Linkam) and a fibre coupling accessory for the sample chamber.
Steady state photoluminescence spectra were acquired using a Xe2 lamp for excitation at 980 nm, the excitation wavelength of Yb3+. The excitation power was low enough not to induce sample heating, which is often observed with laser excitation. The FLS1000 was equipped with double monochromators and a standard PMT-900 detector.
Time-resolved photoluminescence decays were measured in the same instrument using a pulsed Xe lamp (μF2) as the excitation source. Multi-channel scaling (MCS) electronics were employed to acquire the decays, and the experimental
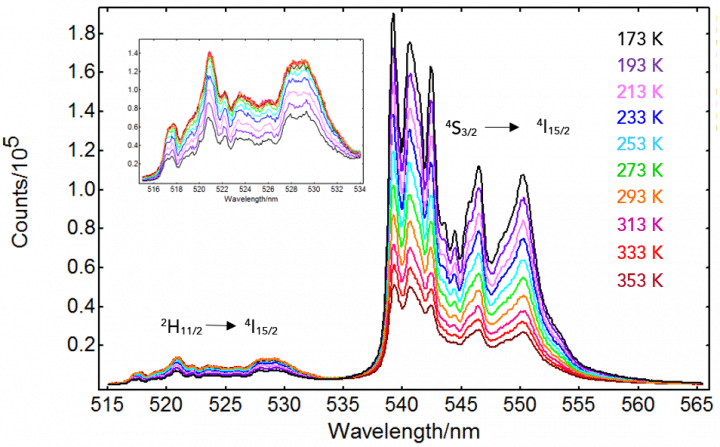
Figure 2: Temperature emission map of NaY0.77Yb0.20Er0.03 F4 measured with Linkam stage in FLS1000, green upconversion emission. Conditions: λex = 980 nm, Δλex = 10 nm, Δλem = 0.20 nm, step size = 0.10 nm, integration time = 1 s/step. The inset shows the 2H11/ 4I15/2 region in detail.
The upconversion luminescence intensity and lifetime of NaY0.77Yb0.20Er0.03F4 has been characterised as a function of temperature using an FLS1000 Photoluminescence Spectrometer with a Linkam stage. The ratio of 2H11/2 → 4I15/2 to 4S3/2 → 4I15/2 can be used to probe the temperature in luminescence thermometry experiments with a sensitivity of 1.0% K-1. The fibre coupling accessory for the Linkam temperature stage enables one to switch easily between microscope characterisation and luminescence measurements, without intermediate sample transfer steps.
Download the Luminescence Thermometry with Upconversion Materials Application Note
Luminescence Thermometry with Upconversion Materials
FLS1000 Photoluminescence Spectrometer
Setting the standard in steady state and time-resolved photoluminescence spectroscopy, our FLS1000 is suitable for both fundamental research and routine laboratory applications. If you carrying out fluoresence spectroscopy research using upconversion materials we’d be happy to discuss your requirements and explain how our instrumentation can help you. For further information on our FLS1000 Photoluminescence Spectrometer, why not contact one of our sales team at sales@edinst.com.
Stay in Touch
If you have enjoyed this application note, and want to be the first to find out about our latest research, applications, product information then simply sign-up to our infrequent newsletter via the red sign-up button below, and follow us on social media.


